Reports
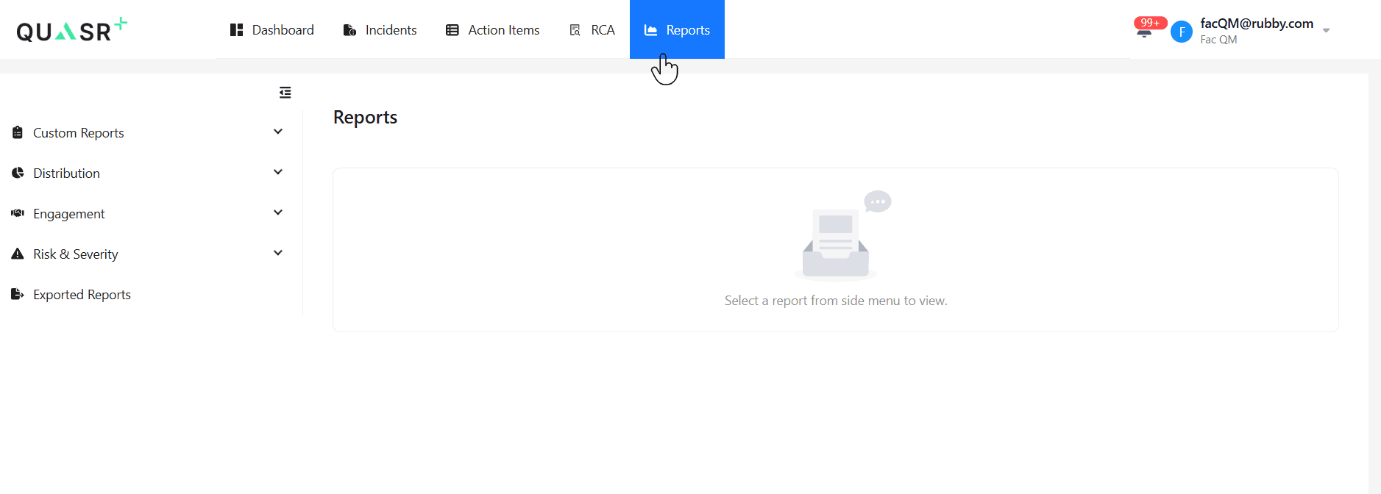
Reports is module in QUASR+ that provides structured, data-rich reports. Each report is designed to deliver clear, actionable insights through organized metrics, visual summary, and detailed breakdowns tailored to the user’s personas.
List of reports available in QUASR+
- Distribution
- Users
- Incidents
- Contributing Factors
- Investigation Outcome Categories
- Action Items
- Engagement
- Incident Metrics
- Risk & Severity
- Potential Financial Loss
- Risk Score
The access to the reports is subjective to user access level and roles. Not all reports are accessible to all the users.
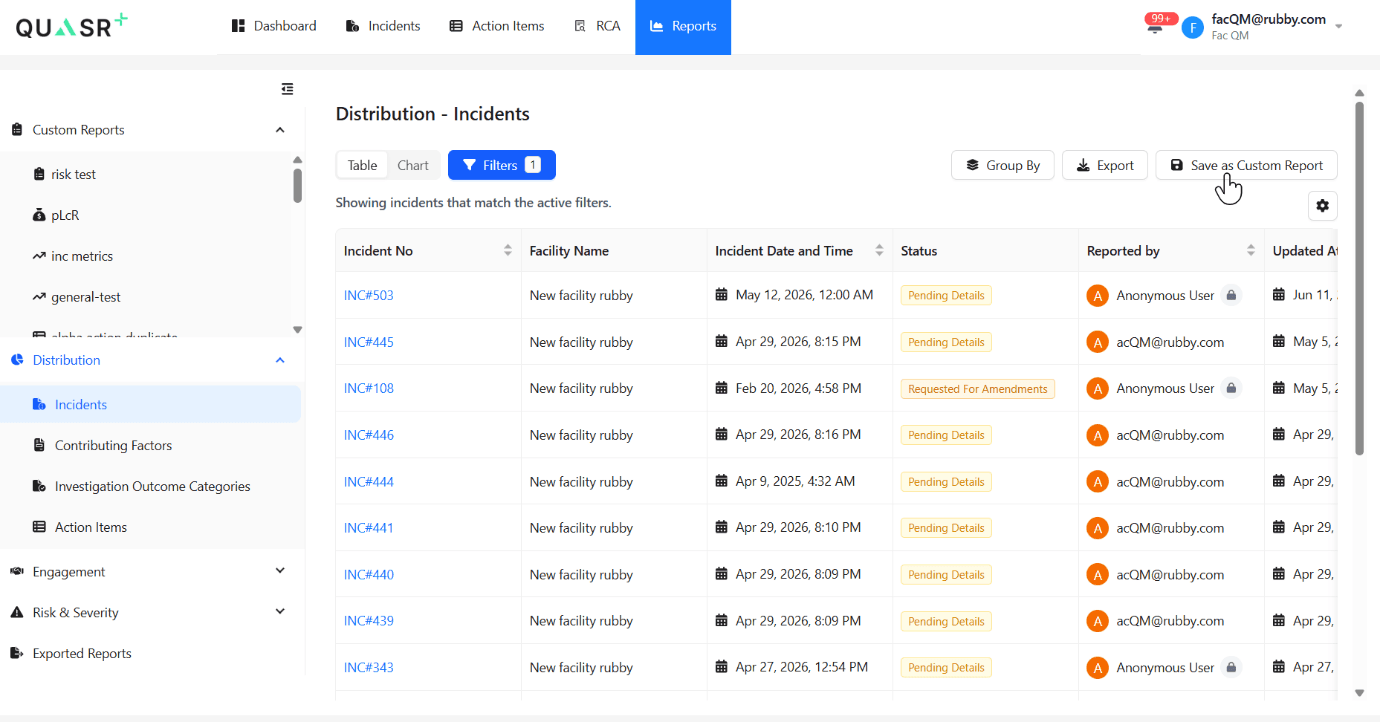
From the basic reports, user can add or remove columns, apply filters, grouping to slice and dice the data. This can also be saved as custom reports. All custom reports will be saved under the custom reports section.
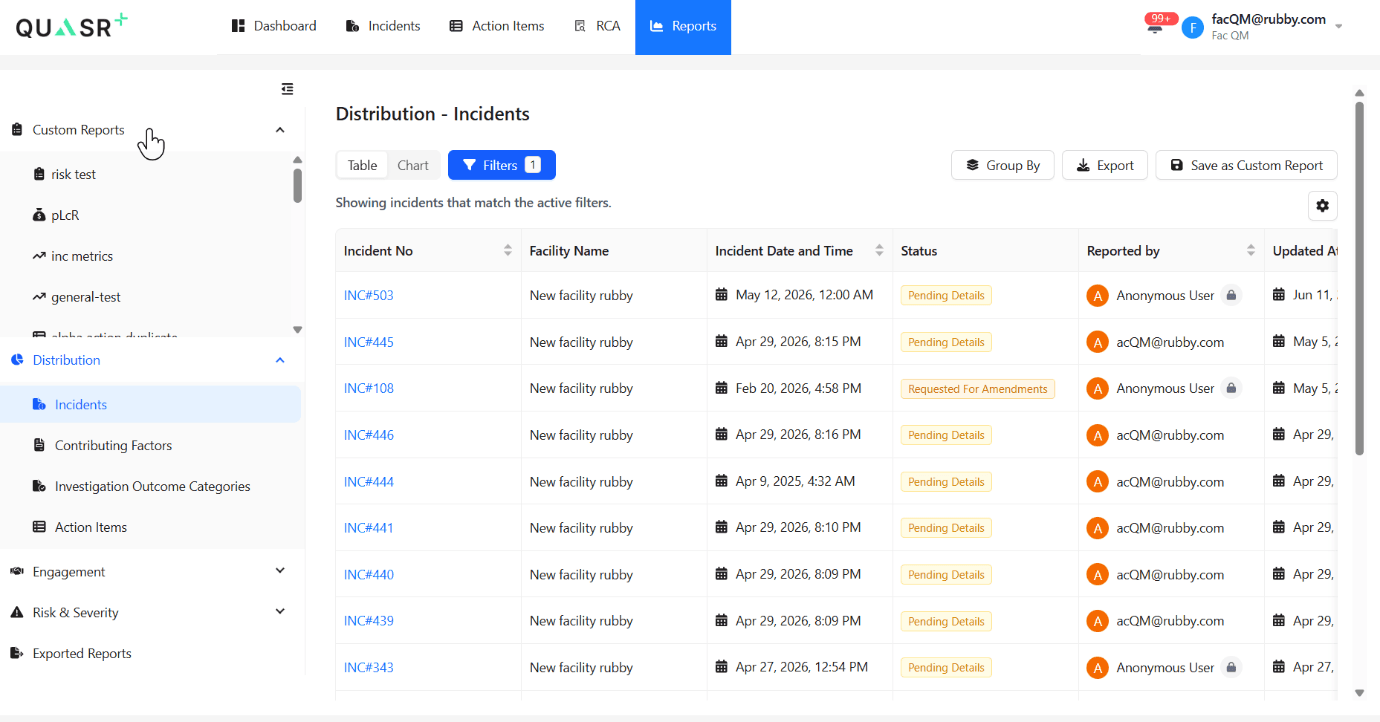
Report Customization Features
Customization features such as filters, grouping, adding or removing columns, and switching to chart views allow users to tailor the report to their specific needs, giving them full control over how data is displayed and interpreted. These interactive tools help users create and save personalized report views that align with their workflow and decisionmaking requirements.
These features are available in all basic reports.
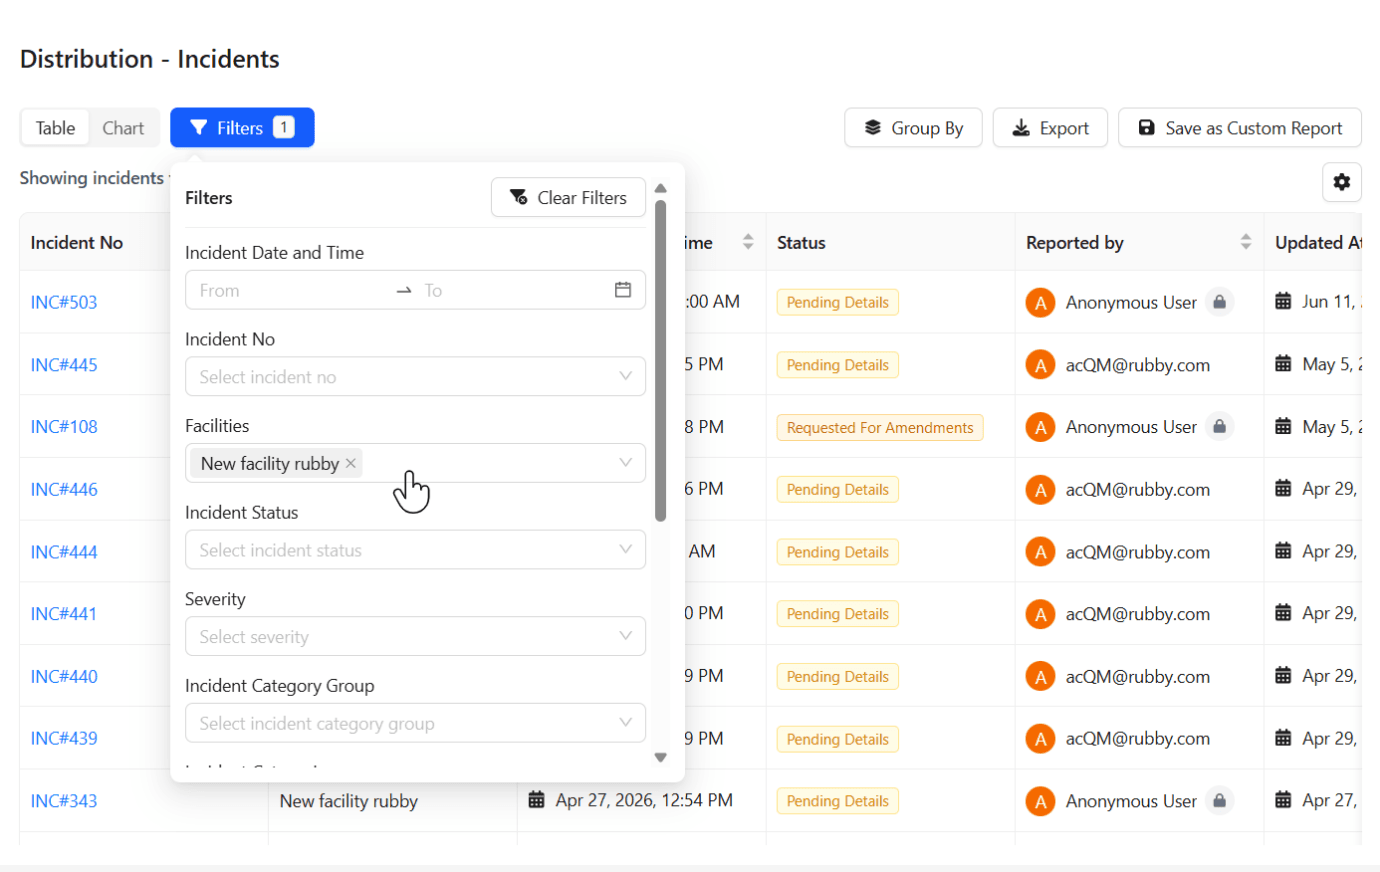
Filters
All columns that are native to the respective report will be available in Filters.
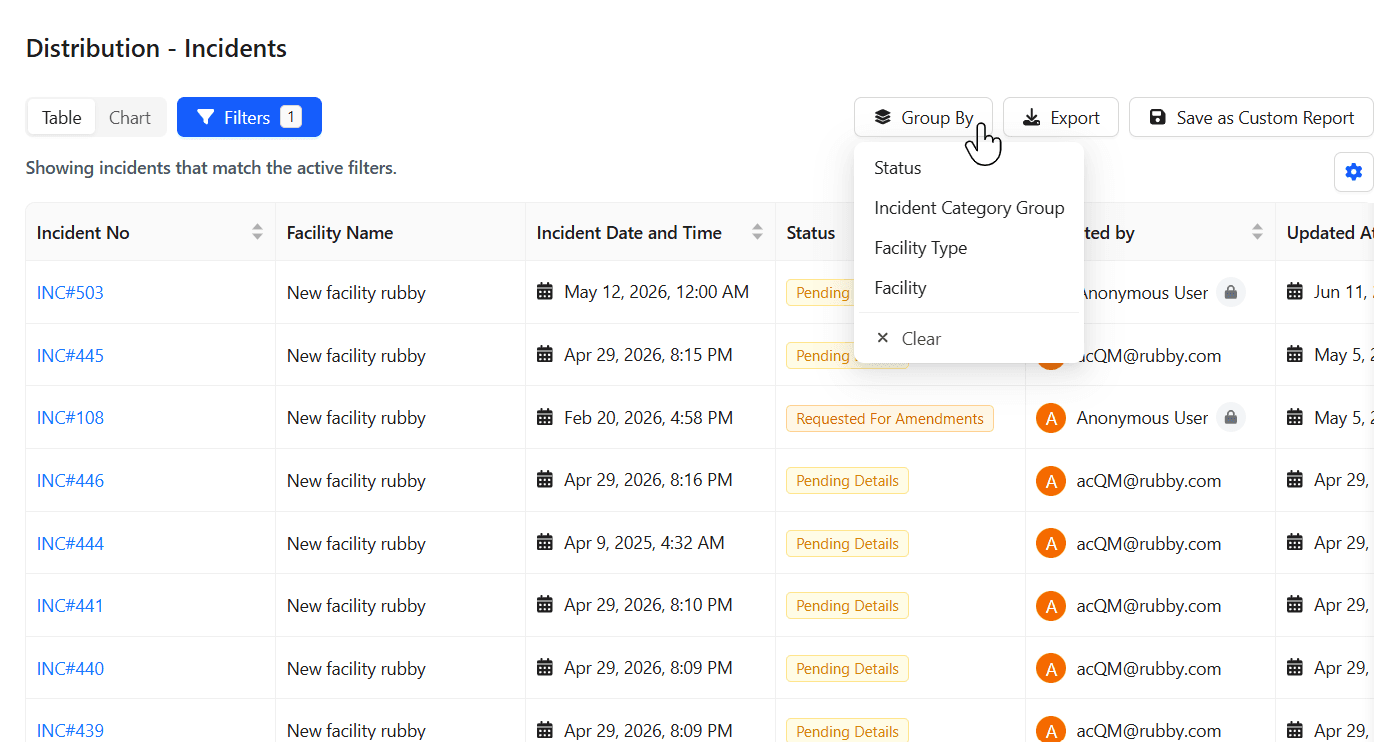
Group By
In each report, the Group By field list is fixed and limited to the native attributes defined for that specific report and it will include only those intentionally configured fields to support grouping within that report.
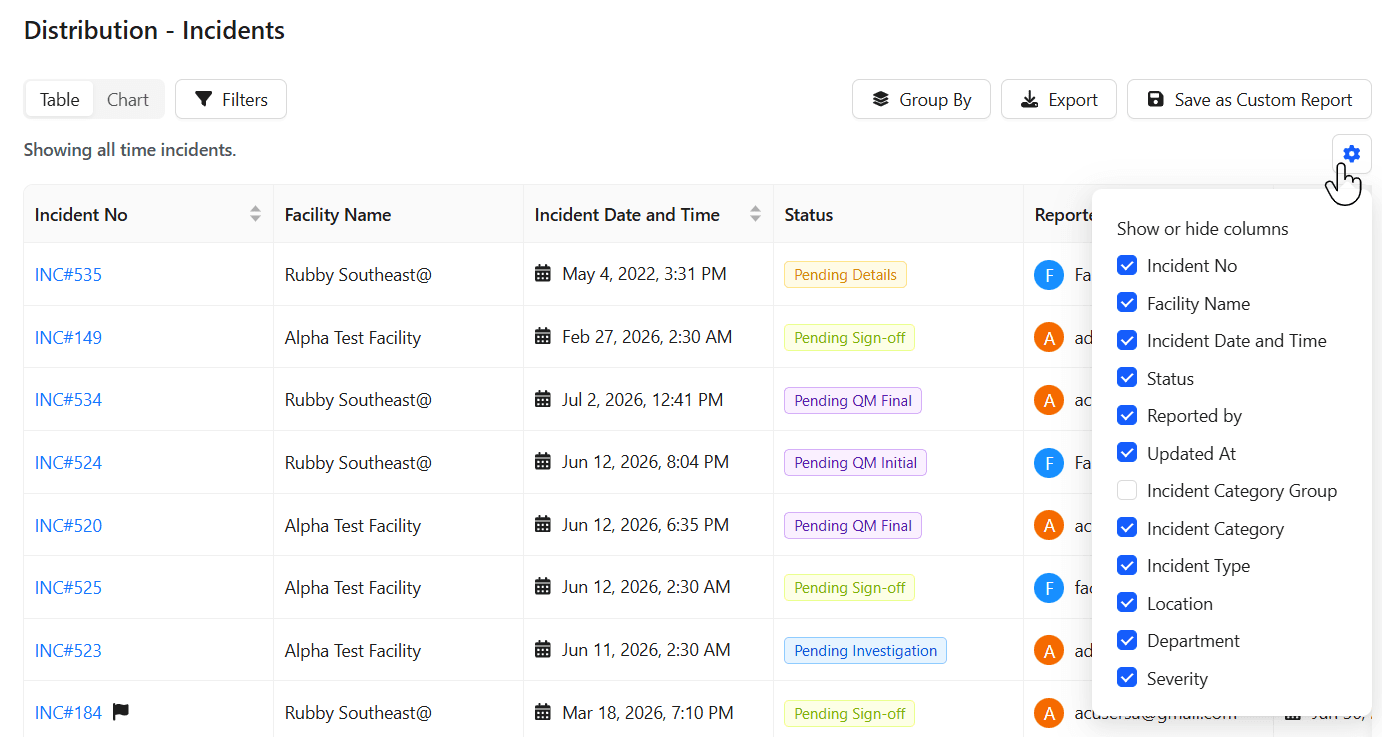
Add or Remove columns
Users can add or remove columns by selecting the gear menu, allowing them to tailor the report layout to their individual needs.
Any column changes made are applied only to that user’s view, while the default column set remains globally consistent for all users.
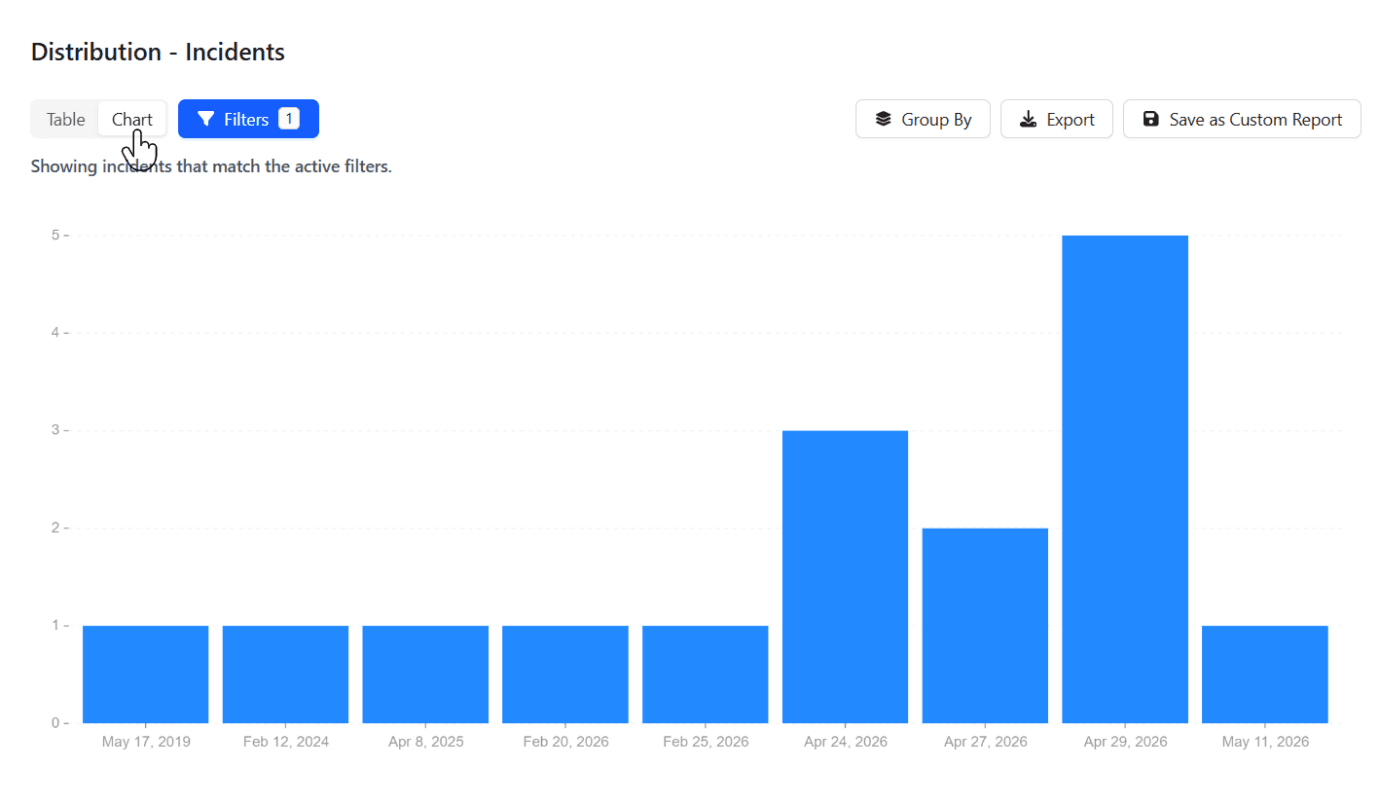
Chart
The chart view provides a visual representation of the data displayed in the table, helping users quickly interpret patterns and trends.
The chart automatically updates whenever filters or grouping are applied to the underlying data, and the chart type is fixed and cannot be changed.
Save as Custom Report
Save as Custom Report allows users to save a report with their preferred filters, grouping, columns, and chart view so they can quickly access the same customized layout later.
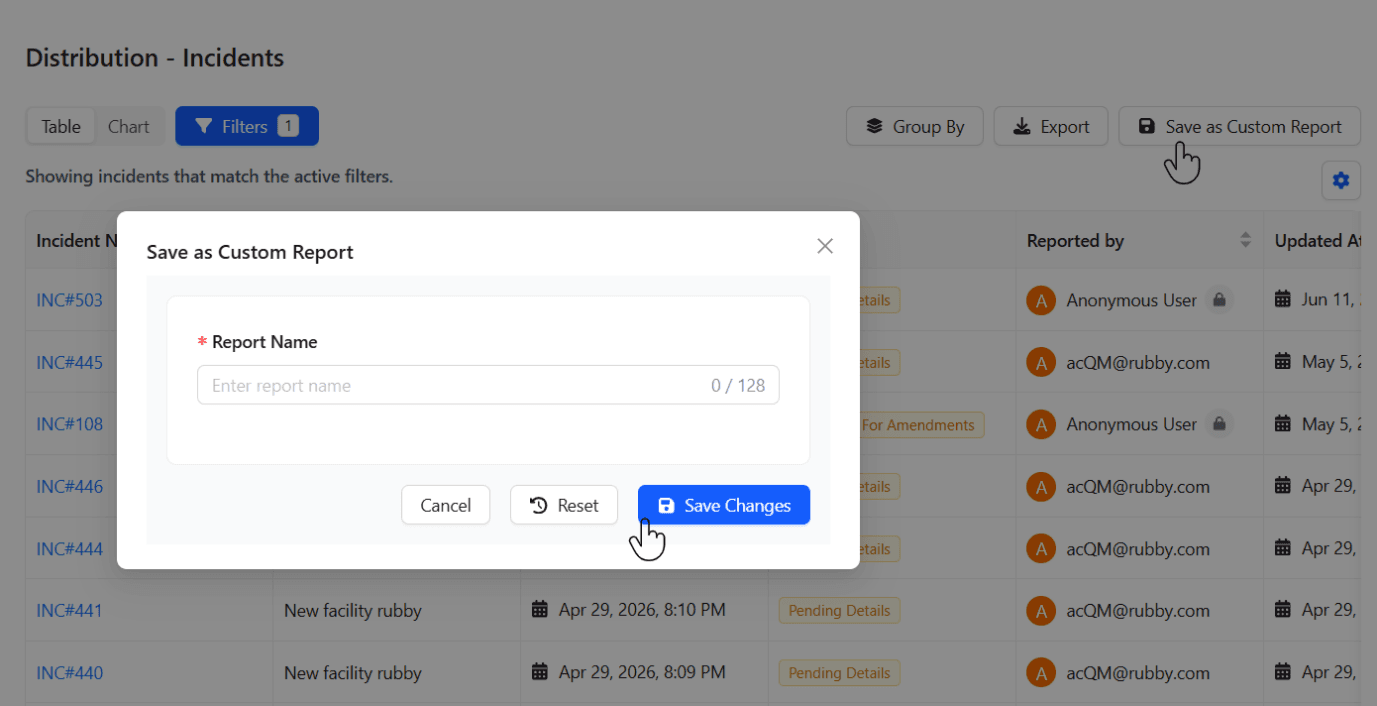
Custom reports created by a user are visible only to that user and cannot be shared with others within QUASR+.
Saved custom reports can be deleted at any time, giving users full control over their personalized views.
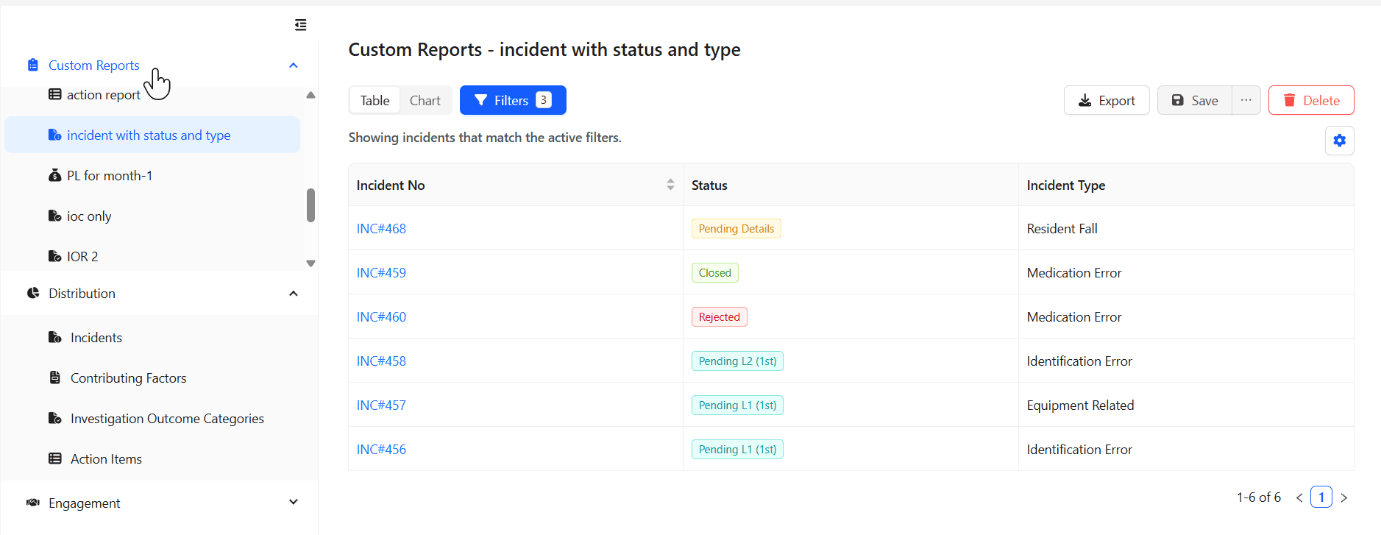
If users make changes to their filters, grouping, or other slicing and dicing options, they can also save the updated version as a new custom report.
Export
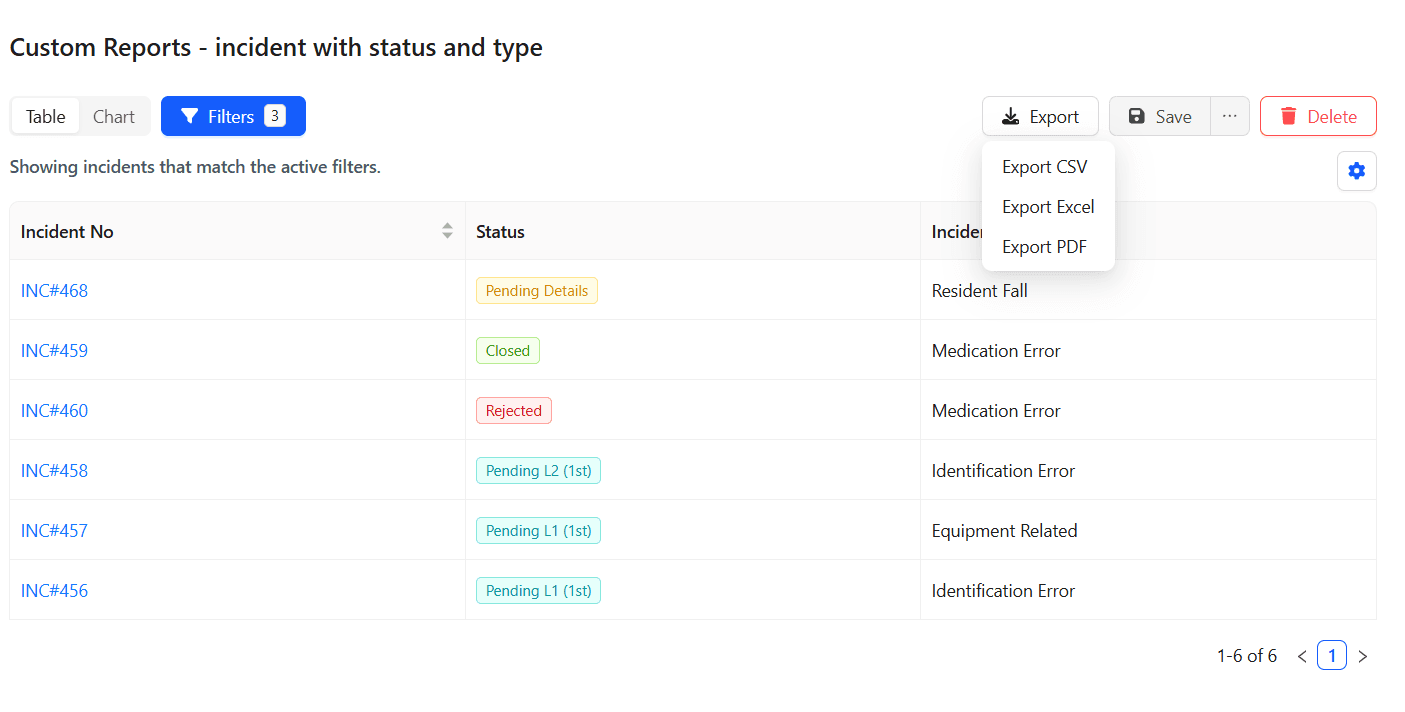
The system allows users to download reports in CSV, Excel, and PDF formats, providing flexibility for offline analysis or sharing outside the platform.
All basic reports and custom reports can be exported.
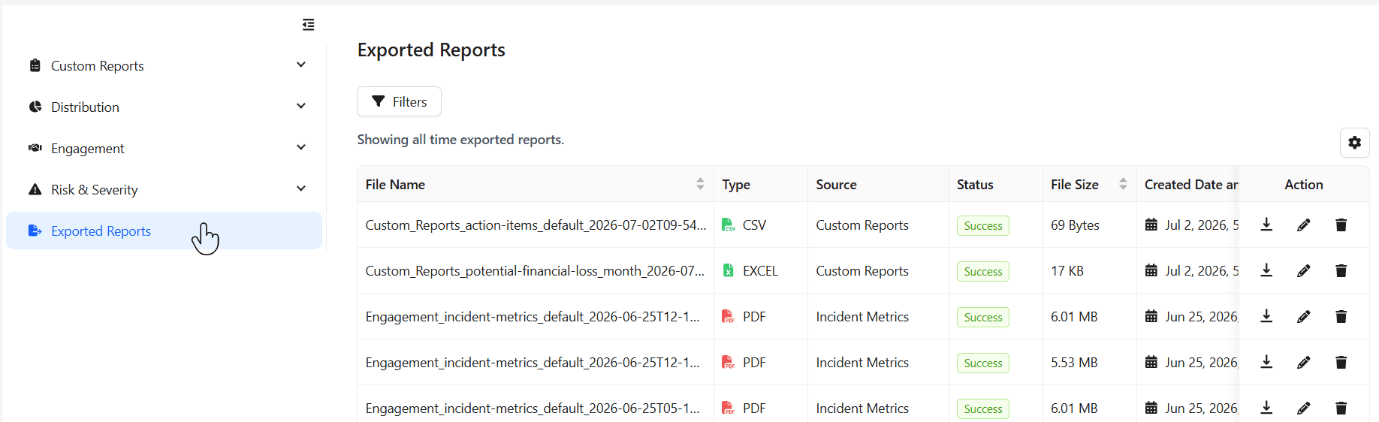
All exported files are stored in the Exports section, where they are visible only to the individual user; a complete log of past exports is maintained, and users can manage these files by keeping or deleting them as needed.
The chart view can be downloaded only in PDF format, and it will be included alongside the corresponding table data in the exported file.